Check and Compare Your Condo Main Financial indicators
against Others
Interactive tool to compare Condo Fees, Market Value, VCI. Toronto & GTA Condos
Post “Request a Quote” on the Ranking Page!
to let Condo Directors “Request a Quote”
right from the Condominiums’ Ranking Page
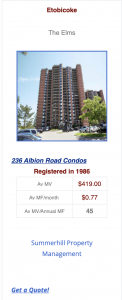
- MF, $ psf
Current Maintenance Fee, $/ per SF, based on current Year information available to the public, updating once a month
- MV, $ psf
Average Condo Market Value, $/ per SF, based on a current Condo sale information available to the public, updating once a month
- AMFG, %/Y
Average Annual Condo Maintenance Fee Growth, %/ per Year based on sale information available to the public, updating once a month
- AMVG, %Y
Average Annual Condo Market Value Growth, %/ per Year based on sale information available to the public, updating once a month
- MF, $ psf
Current Maintenance Fee, $/ per SF, based on current Year information available to the public, updating once a month
- MV, $ psf
Average Condo Market Value, $/ per SF, based on a current Condo sale information available to the public, updating once a month
- AMFG, %/Y
Average Annual Condo Maintenance Fee Growth, %/ per Year based on sale information available to the public, updating once a month
- AMVG, %Y
- VCI
Average Market Value of a Condo, $ per square foot to Annual Condo Fees, $ per square foot
that might facilitate condo boards and owners in a comparison process and understanding which condo building spends less to maintain a decent market value of a condo. It might be helpful in Property Management Company / or Property Manager selection.
Exceptionally High Value Segment – Av Market value $1500 and less per sf;
Very High Value Segment – Av Market value $1350 – $1500 per sf;
High Value Segment – Av Market value $1000 – $1500 per sf;
Average Value Segment – Av Market value $700 – $1000 per sf;
Low Value Segment – Av Market Value $700 and less psf.

